COVID-19 statistics – how to read it and what it means

The ever-wise Homer Simpson once remarked that “Aw, you can come up with statistics to prove anything, Kent. Fourteen percent of all people know that.”
While all untimely deaths are sad affairs, the statistics being paraded daily about, and only about, COVID deaths have been thrust in everyone's faces every waking moment.
Improperly understood, this provides an opportunity to deceive. The deception may not be intentional,
but it may well be convenient for political purposes, misleading or excusing
leaders to lock down entire states and to silence dissent, while simultaneously it hides the fact that jobs are destroyed, debts are mounting and additional and unreported non-COVID
deaths are quietly surging. In short, the propaganda is hiding the possibility that the cure might be
worse than the disease.
How is the statistics doing this? Is not the pandemic infecting tens of millions and killed over a million world wide? It's not perhaps that straightforward. Let’s take the United States as a case study. It is the third largest country by size and the third most populous (328 million). Indeed, if Germany is not counted, The US population is roughly equal to the 26 other countries of the European Union combined (357 million).
It is also the
country that undertook the most number of coronavirus tests (110 million), testing more than 290,000 per million of its
population. In comparison, among other most populous countries, India has
conducted 70 million tests (50,900 per million), Brazil 14.5 million tests
(19,800 per million) and Japan 2.2 million tests (17,700 per million). Its
numbers are also well ahead of, in both absolute number and per million
population, other first-world countries such as Germany, Switzerland, Finland,
Norway, France, Netherlands and Australia.
The statistics
updated on the 28th of September by the CDC
gives a breakdown of death causes. Looking at the causes of deaths where COVID-19 was listed on the death certificate (188,470
in total, updated 23rd of September), we can immediately rule out
6,171 deaths that were caused by “Intentional and unintentional injury,
poisoning and other adverse events” as deaths because of COVID. Indeed there have been numerous reports of deaths
from obviously non-coronavirus means being listed as COVID deaths, such as this
Florida man who unfortunately died in a motorcycle crash.
Deaths of people
with Alzheimer’s disease (6,626) and other dementias (21,111) who tested
positive for COVID total 27,737. While some of these deaths in mostly elderly
people would certainly have been quickened by the coronavirus, a conservative
estimate might be only 15-20% (around 5,500) if we use data from a study in Nature that examined the risk of death from coronavirus
according to age.
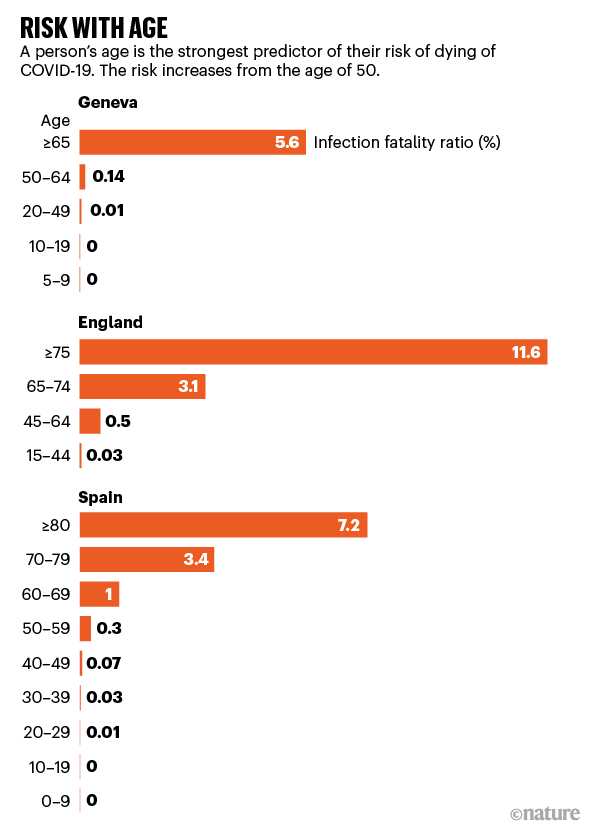 |
| Note the average age of dementia onset is around 80 years |
On the other hand, the Washington Post reported that more than 134,200 people with dementias have died since March in the US, with 13,200 more deaths than expected. One reason given for this excess is the social isolation, which leaves those suffering dementia, especially in nursing homes, depressed, lonely and frail. Hence not only is a large portion of the 27,737 deaths most likely not caused or exacerbated by the coronavirus, the policies supposed to protect the most vulnerable might be killing more of them than they are saving.
Deaths of
COVID-positive people who also had circulatory diseases such as cardiac arrest,
ischemia, and heart failure total 128,279. Heart disease is the number one killer in the US, taking 655,000 lives annually. Even if we
say that 50% of the coronavirus-positive deaths are directly attributable to
the coronavirus – a very conservative
estimate according to research, that would still mean more than 60,000 deaths which
are currently counted towards the coronavirus tally should be excluded. The
same logic would apply to the 8,583 deaths of people with malignant neoplasms
(cancers), 30,517 with diabetes, and 16,405 with renal failure.
Another factor
that is seldom emphasised in the news is the very clearly biased danger the
virus poses towards the elderly. Out of the 186,101 deaths involving
coronavirus, 146,847 (79%) were in those aged 65 or above, who make up only
15.6% of the population. If you look at deaths from all causes in the US, the
proportion of deaths so far this year in those aged 65 or above is 1,497,021,
or 74% of the total of 2,022,937. This suggests that even in the vulnerable
elderly, the coronavirus is not increasing death rates astronomically. Before
you say that the lockdown has prevented more deaths, a July study examining data from 50 countries with the most
coronavirus cases found that full lockdowns did not affect death rates. On the
other than hand, data suggest that harsh lockdown measures have resulted in large increases
of preventable deaths from other causes, disproportionately in the elderly,
which do not get the same PR as the coronavirus.
Hence a careful
analysis of the statistics would suggest tens of thousands of deaths on the
cumulative tally attributed to the coronavirus in the US should not be counted
as such. Indeed, as early as May, Dr Deborah Birx, the White House’s coronavirus task
force response coordinator, an expert in global health and vaccine research who
had also served under the Obama administration, suspected that CDC’s statistics
on COVID deaths may be inflated by up to 25%. The latest data would mean that
the CDC, which had already adjusted the death rate of the virus from 5 percent
in May to 0.26 percent in early September, might lower the true death rate still.
If the true
death rate approaches 0.1 percent, it will be on par with that of the seasonal
flu. And if the death rate for those under the age of 50 is well under 0.1
percent, as an August Nature report found, then the correct adjustment would be to implement a tiered
lockdown system where the relatively young and healthy individuals can be
allowed to go back to work or school, whereas the elderly and the ill are
looked after with concentrated resources. However, no adjustments have been
happening in many cities and states across the world.
In the light of
evolving scientific data, it looks more and more likely that the Swedish reaction might be the wisest of all. Despite being maligned by
a media that seems to yearn for authoritarianism, Sweden, where no lockdown has
ever been imposed, is not seeing the resurgence in case numbers like many of
its European neighbours who had resorted to harsh lockdowns. This suggest that
the Swedish population may have reached herd immunity. The damage the pandemic
has done to its economy is also much smaller, shrinking by 9 percent, compared
to the UK’s 20 percent.

The ultimate
irony might be that in locking down for too long and in spite of the evidence,
the authorities have denied their populations the chance to develop their own immune
systems, while making them poorer, unhappier sicker and less free. If the
governments truly believe in science, then their views should evolve with the
evolving data. If not, they will have revealed themselves as only believers of
dogmatic Scientism rather than true science, where uncertainty and a willingness
to change one’s mind in the face of new evidence is the default position.


Comments
Post a Comment